| Teachers Log: Mr. Bartram
SIO Summer 2004 |
Back to index |
| ERESE
Teachers Log - general guidance
about the lesson |
|
| Lesson
title |
How do scientists get, use, and apply data? |
| Intent
of the lesson - the blue lettering indicates
that any other problem can be inserted into the Intent of the lesson |
Objective - Students will
be
able to discriminate between relevant (useful data sets) and irrelevant
(non usable data sets)
to identify
plate boundaries
|
| Ed.
standards - both National
Science Standards and California Science Standards |
National
Science Standards Content Standard A - Science as
Inquiry
1. Abilities necesssary to do
sceintific inquiry
2. Identifying concepts that guide scientific investigations 3. Design and
conduct scientific investigation
Content Standarde D - Earth
and Space
1. Geochemical cycles
2. Origin and Evolution of earth system Content Standard E -
Science and Technology
1. Propose designs and choose
between alternative solutions
2. Communicate the problem, process, and solution Content Standard G - History and
Nature of Science
1. Science as a human endeavor
2. Nature of science knowledge California State Standards 1. Earth Science Processes - 3
Plate
Tectonics - a,b, and f* - 7 Biochemical Cycles - d* - 9 California
Geology d*
2. Investigation and Experimentation - Scientific Investigations - a, b, c, d, h, i, k, l, |
| Orientation
- the following section (in salmon
colored background) is transparent to students
and is guidance to myself
about the lesson |
Introduce
available tools and concepts so that students feel safe taking
intellectual risks
|
| Intent
- What I think I am going
to achieve |
To
identfy what the student knows and then to transition into what the
student does not know about how to use research information -
discussion and competition |
| Procedure
- my plan |
Level
3 instructional pedegogy:
|
| Evidence
- how will I know I am on track? |
I
hope to see the following questions being asked and possibly answered
during the initial discussion phase. 1. What is a plate boundary? 2. What is a data set? 3. What types of maps are these? 4. What do these maps show? What place? |
|
Teacher - this is what I want the
students to pick up. |
3
How do scientists determine what information is available and then
decide whether the information is useful or not? |
|
Student - broadbased procedures
students follow |
2.
Students will brainstrom how to gather data based on a review of
selected maps and then decide how they
might begin to discrimate between pieces of information by looking at
various maps. |
| Fieldwork
- what the students will do and
guidance about my expectations |
Give
students experience to foster their intererst and ownership; provoke
students to explore, observe and generate their own questions about the
phenenomon. 1. The phenomenon are based on
two sets of maps
2. There is a necessary "frustration factor" built into the sequence - be prepared for students to balk at not understanding what it is that they are doing - PATIENCE! |
|
Intent |
Guide
students in focusing their observations of different maps |
| Procedure - what the exact sequence will be that duplicate the genenral intent of the written instructions | Student Worksheet -
This is linked to my web page at my school I will hand out a paper that will provide instructions on how to conduct the experiment . I will have 8 sets of data, each set will have 2 distinct map pages with 2 maps per page for analysis. One is bathymetric another is magnetic (age) 1. Initially: Students will be allowed 10 minutes to examine each of the maps and respond to the questions from the instructions . This is just the begining of the instruction Each group must record group analysis of maps. and provide at least 4 observations per map. Anticipated Observations: Here are sample observations you MAY encounter. What scale is the map? What are we looking at? What do the colors mean? Does the topography of the ocean floor mean anything? Which plates are these? Where are the plate boundaries?
What do scientists do with this
data?
Group: Report out on butcher paper1. The observations MUST go on
the butcher paper.
2. Have them put everything down
and then the class can help descriminate!
Students write common observations on own paper. Based on teacher
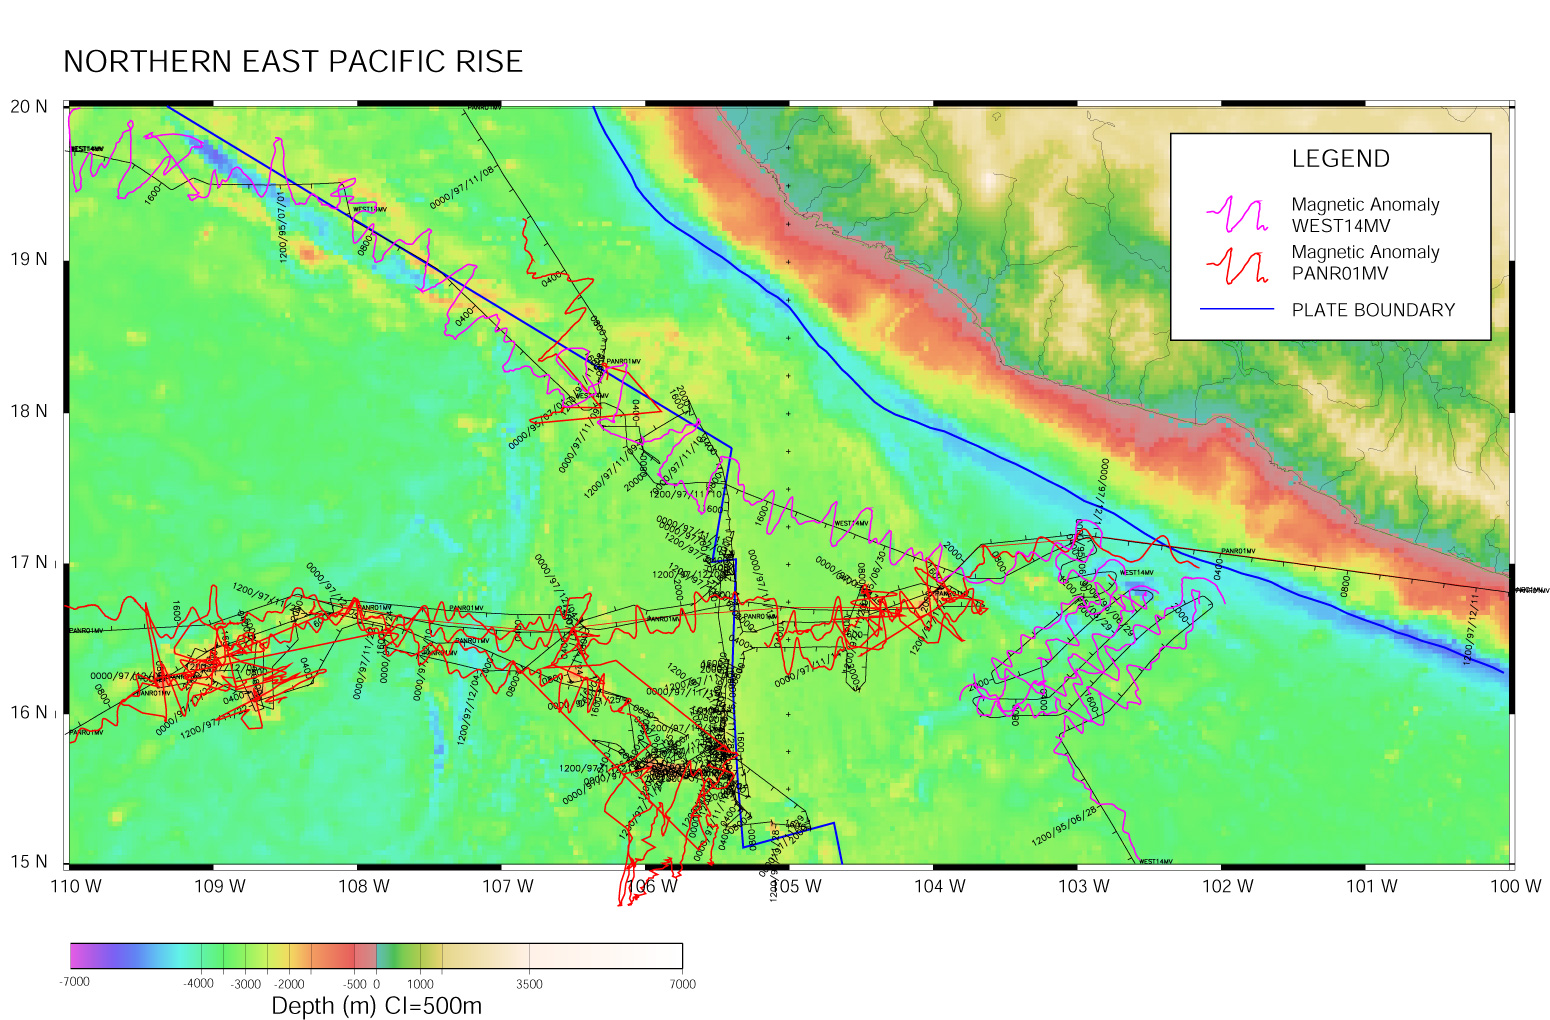
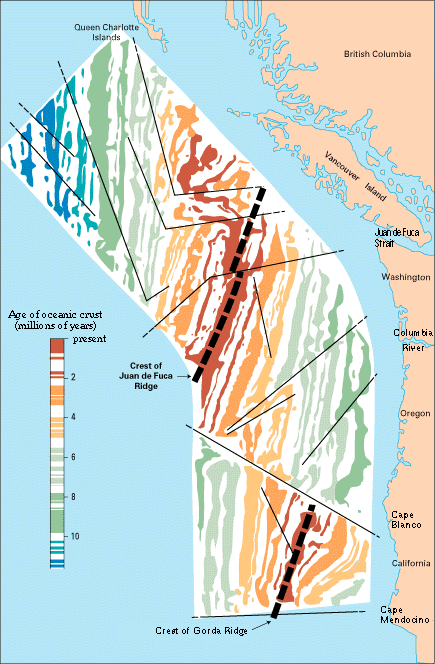
grouping. Provocative Phenomena are: Bathymetric - Hawaii and Hawaiian Chain Bathymetry Bathymetric - Global Seafloor Ages Geomagnetic - Cantral America Maps Bathymetric - Juan de Fuca |
|
Evidence |
Questioning
that demonstrates a shift in the ownership of the question FROM the me
to the students. |
|
Teacher |
2;
providing focus for observation and allowed for adaptation. I
will ask the following types of questions,
|
|
Student |
4;
Generates independent observations. Observations on butcher paper
for eventual class discussion my the students. |
| Debriefing |
Teacher honors all student observations, questions and hypotheses in order to identify and discuss their viability as a reserach topic. |
|
Intent |
Facilitates
Learners in generating questions. |
|
Procedure |
MSWord
Document: Student Worksheet Ask each student to share observations, record observations for all to see. Start with observations from each "group" and go around the room until no one has new observations or questions. Encourage questions that begin with "I wonder why..." or "I wonder what....". After the students have exhausted questions I will consolidate the group observations according to my desire to focus the attention of the lesson on selection of relevant and irrelevant data. Discuss researchable hypothesis and have them state whether each map could be used as a source for support of the research hypothesis. At this point be prepared to adjust the depth of the instruction based on the ability of the students to understand the focus of the lesson: Which map(s) are/can support the question? |
|
Evidence |
Probing
questions |
|
Teacher |
1;
Provides an opportunity to generate questions. Ask students to
elaborate on observations - "What else did you notice?", "How does that
relate to ____?" |
|
Student |
4;
Generates a question. They will be able to connect their observations
and questions to the underlying themes by answering and elaborating on
my probing questions. |
| Experimental
design |
Design
an investigation wherein students gather and analyze data that address
the identified question SEE MSWORD
INSTRUCTIONS |
| Data
collection |
Define
approach for collecting data - this is written out on the butcher paper
for all to see and compare |
|
Intent |
Assist
each group in idenitfying major concepts necessary to answer their
questions and as well as the procedure that will be used. |
|
Procedure |
Researchable Hypothesis:
Which data provides support to the quesion? Possible Content Lessons:
|
|
Evidence |
Questioning |
|
Teacher |
2;
Guides students to what evidence to collect and how to collect
it. "What are you going after?", "What kinds of data do you
need?", "Where will you get it?" |
|
Student |
3;
Guided to collect specific data. They will be directed towards
the digital library but left on their own to choose which objects will
help to answer their question. They should be saying things like,
"What do we need....?", "What facts or ideas address our topic?" |
V1.01 2004-07-08