An important aspect of our cruise has been collecting multibeam sonar data to map the ocean floor. Why is this important? Don’t we already have a map of the ocean? Hasn’t Google already done that?
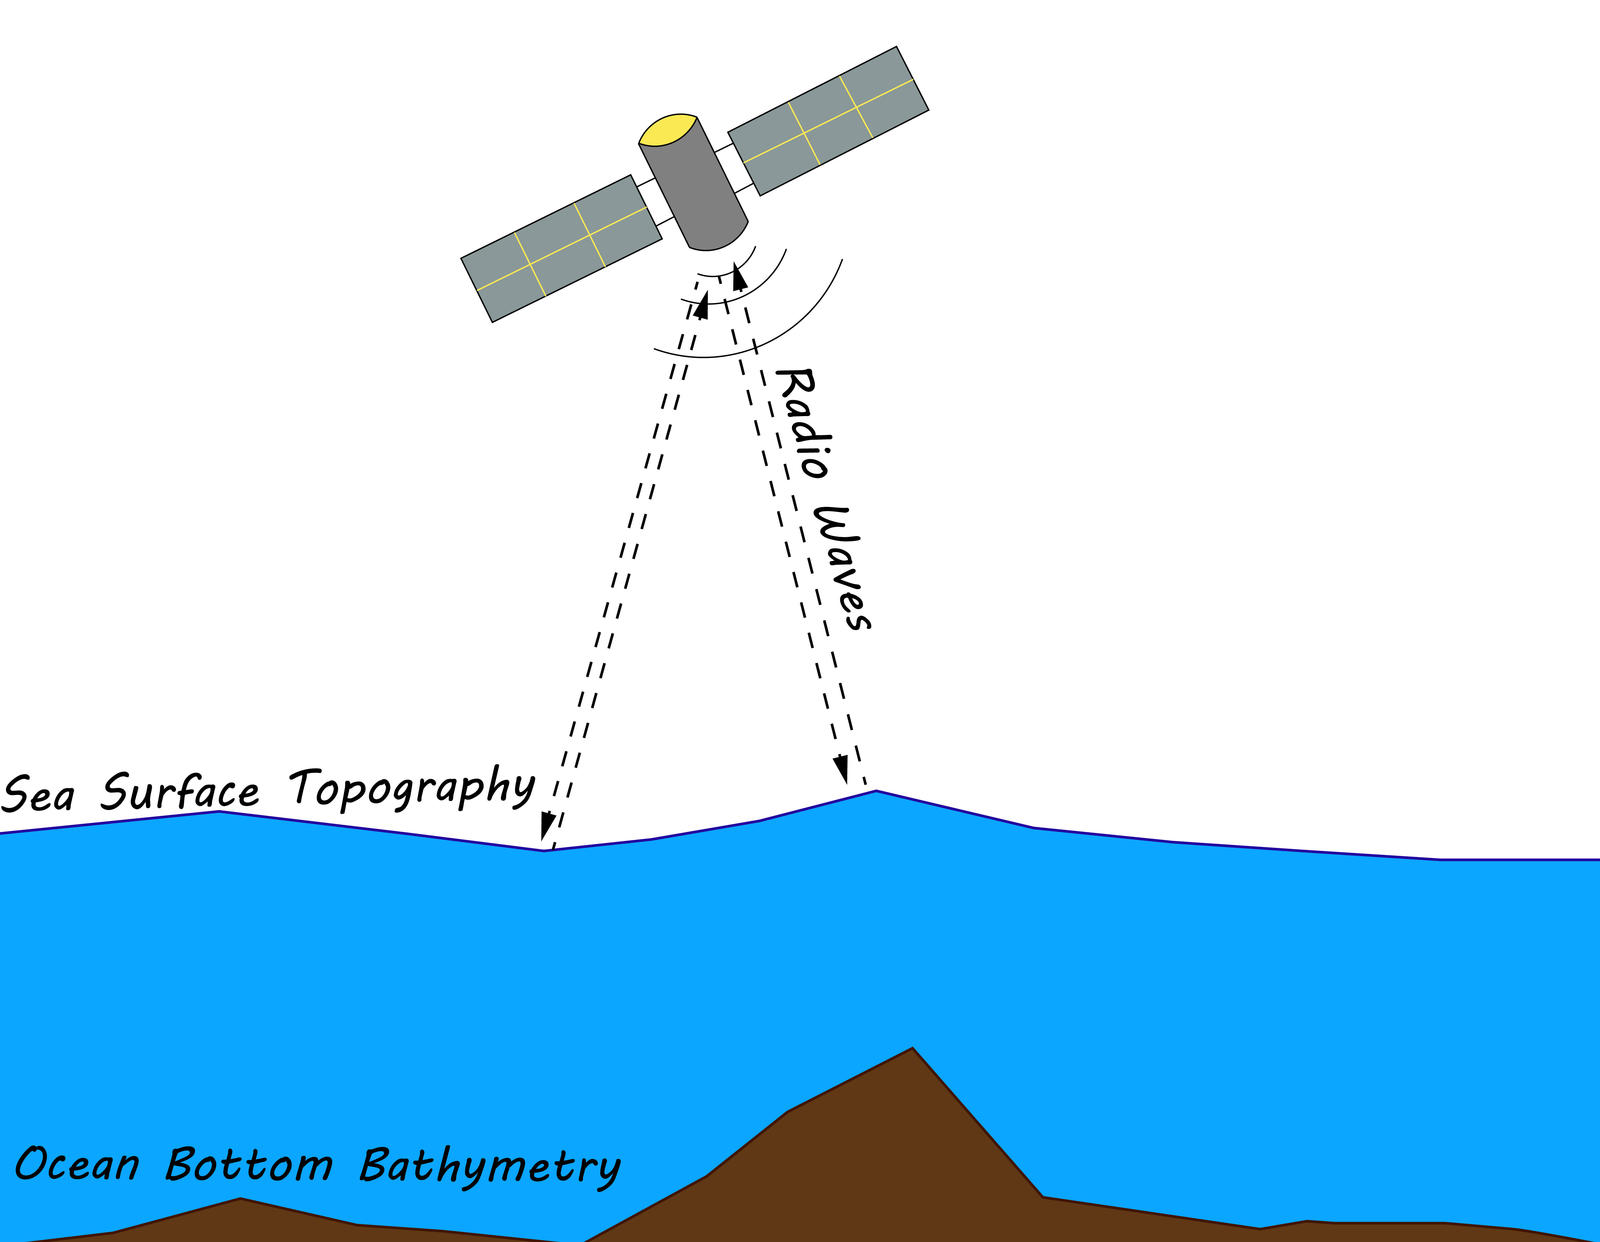 The map of the ocean that you see on Google Earth is mostly predicted bathymetry (seafloor depths) based on the technology of satellite altimetry and has not actually been mapped by someone on a ship. How do we get a depth to the seafloor from satellites? To answer this, we first have to bring in the concept of Earth’s gravity. The Earth’s gravitational field varies at different points on Earth based on changes in mass and distance. Because of these changes in the gravitational field, the surface of the ocean is not actually smooth and flat. It instead bulges up and down, mimicking the seafloor below due to the variations in the gravitational pull. The difference in the sea surface height is too small for us to notice normally, but we can measure it using satellites. The satellites bounce radio waves off the surface of the ocean and output a distance to the water surface based on the time it takes to send and receive the signal. A bathymetry measurement is then derived from a satellite altimetry measurement by comparing it with known depth soundings in the ocean.
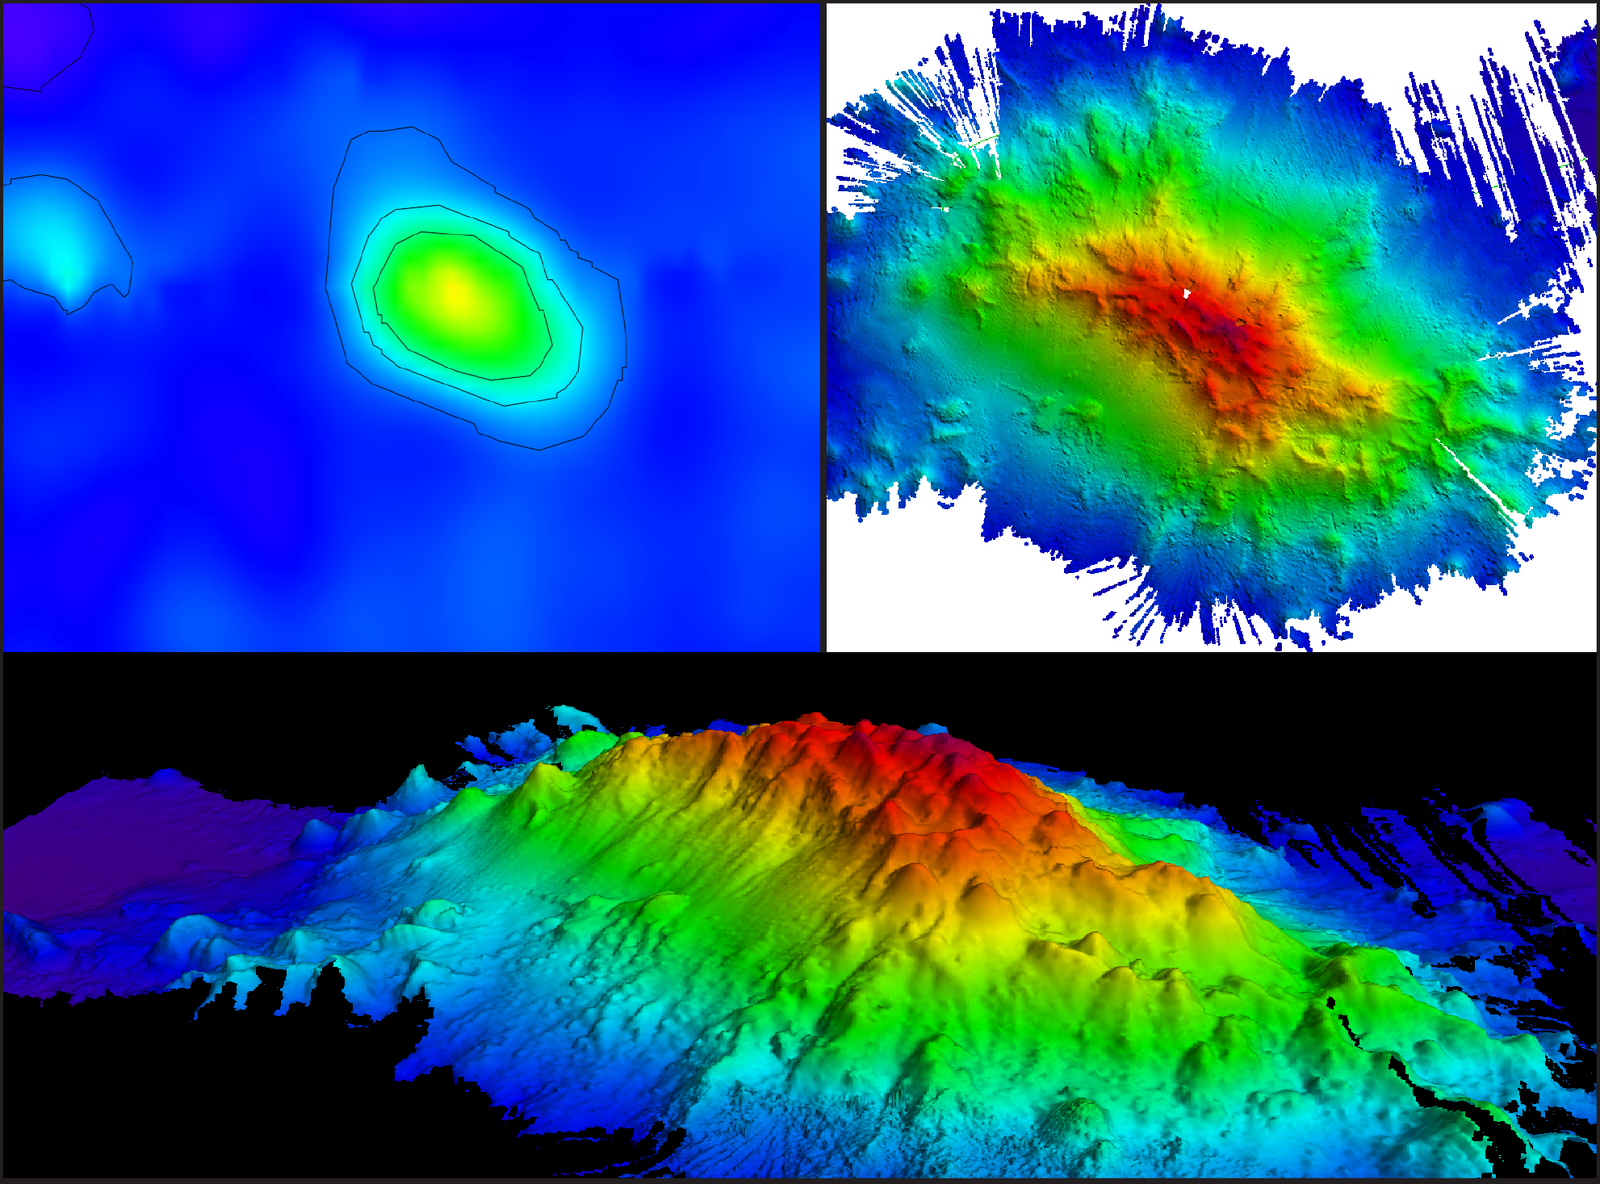 Predicted bathymetry is great in that it gives a map of the entire ocean without ever having to leave your couch, but it is limited in its resolution of the seafloor bathymetry. With a resolution on the order of 10s of kilometers, it is just too low to accurately reflect what’s on the seafloor. Figure 2 shows just how inadequate the predicted satellite bathymetry is compared with the high resolution multibeam sonar bathymetry we obtain by mapping on-location from a ship Multibeam has a much higher resolution of 10-100s of meters. The seamount shown was the site of dredge 20 on our cruise. In order to properly dredge it, we needed more information than just the satellite bathymetry could provide so that a suitable dredge location could be found. Even though the seamount rises ~3000m from the seafloor and covers an area of ~395km2 it appears as nothing more than a blob on the satellite bathymetry map. Higher resolution multibeam gave us the chance to pick out the best slope to increase the odds of a successful dredge.
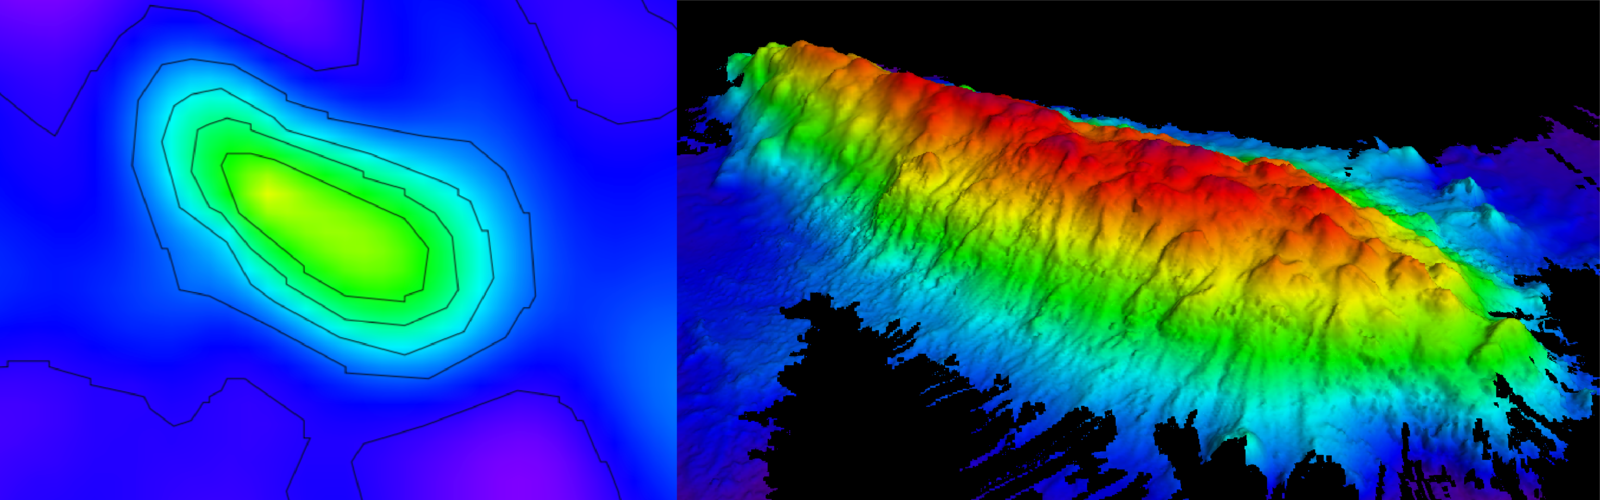 Higher resolution bathymetry helps us understand the features on the seafloor as well. In the comparison in Figure 3, the seamount in the predicted bathymetry map appeared to possibly be a flat-topped seamount called a guyot which indicates that at one time the seamount was above the sea surface and was eroded. However after mapping the seamount with multibeam sonar you can see that it was actually not a guyot and probably never existed above the ocean surface.
Providing a more accurate map of the ocean floor around Rio Grande Rise is one of the important aspects of this cruise. Currently only about ~10% of the ocean floor has actually been mapped. It’s crazy to think we actually know so little about our own oceans, but thanks to scientific endeavors like this cruise, hopefully one day we will have a fully explored ocean.
By Matt Sexton
- 2164 reads