Weekly Report 7 -- Thursday, 29 March 2012
Magnetic Anomaly Mapping and Walvis Ridge
A curious property of the Earth’s magnetic field combined with the behavior of volcanic rocks give Earth scientists a powerful tool for understanding the history of ocean basins. The Earth appears unique among the rocky planets in having a strong magnetic field, apparently the result of vigorous convection of fluid iron in the outer core. What is more, the geomagnetic field generated in the core looks very much like the field of a bar magnet nearly aligned with the Earth’s rotation axis. This property was a boon to mariners of the past who could determine the direction of the north pole using a compass. But the geomagnetic field also has a curious behavior – it changes its orientation.
At irregular intervals, the geomagnetic field undergoes what is called a “reversal” that looks much like the internal bar magnet flips end-over-end to point the opposite way. If you were a boy or girl scout with a few thousand years to kill, you could watch your compass switch from pointing north to pointing south during a reversal. By convention, scientists who study the magnetic field call the present-day direction of the geomagnetic field (in which the north-seeking south pole of a magnet points north) as “normal” and the opposite direction “reversed”. In the last few tens of million years, the magnetic field has flipped several times per million years on average. Scientists have studied these flips of the magnetic field and constructed a time series of magnetic reversals, called the geomagnetic polarity reversal time scale (GPTS). Because of the irregular nature of the reversals, we can recognize patterns of reversals like fingerprints and identify them like old friends.
All of this might be academic except for a lucky property of volcanic rocks. Most contain iron and iron is magnetic. A simple analogy is that when volcanic rocks cool, little magnets in the crystal structure line up with the magnetic field and after the cooling is mostly done, those little magnets are locked in place. Basalt, which is the primary rock of the oceanic crust, is a particularly good recorder of the magnetic field. When oceanic crust is formed, magma is injected at the mid-ocean ridge, where it cools and records the magnetic field direction. As the plates move apart, more magma is injected at the ridge where it continues to record the magnetic field direction at the time it cools. With time, the geomagnetic field reverses and the new polarity (direction) of the magnetic field is recorded. The end result after many reversals is a pattern of magnetic “stripes” that are parallel to the mid-ocean ridge. This pattern matches the GPTS and we can determine the age of the seafloor by identifying the magnetic anomalies and correlating them to the GPTS. In this way, scientists can determine the age of the oceanic crust without actually dredging up a sample and spending a lot of time and effort to determine a date for the rock. Because a given magnetic polarity occurs everywhere on Earth at the same time, magnetic anomalies provide a marker to show where the mid-ocean ridge was located on any particular plate at that time.
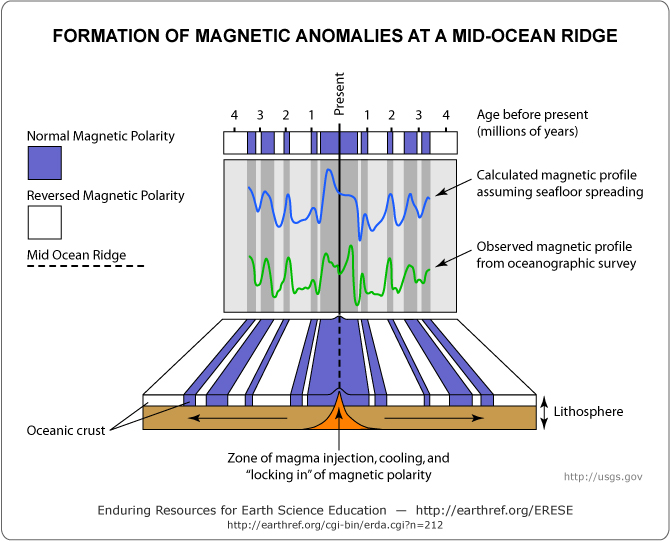 Diagram illustrating the formation of magnetic anomaly “stripes” at the mid-ocean ridges. As the plates move apart at the spreading ridge, magma is injected beneath the ridge where it cools and records the direction of the magnetic field at that time. As time goes on, the magnetic field changes its polarity and this is recorded in the new magma emplaced at the ridge axis. With changes in the polarity of the geomagnetic field, magnetic stripes are formed parallel to the ridge axis. These magnetic stripes can be detected by towing a magnetometer across the sea surface to pick up “anomalies” (changes in magnetic field strength) in the magnetic field caused by the changes in ocean crust magnetization. Normal magnetization areas of the crust tend to add to the overall geomagnetic field whereas reversed magnetization stripes tend to cancel out some of that field. The result is magnetic “anomalies” where the geomagnetic field is stronger or weaker than expected. From the pattern of magnetic anomalies, magnetic reversals of different ages can be recognized.
 What does this have to do with the volcanic seamounts of Walvis Ridge? We are trying to figure out how these seamounts came to be and their formation in time. A leading hypothesis for the changes in the shape of seamounts along Walvis Ridge is that the melting anomaly that was forming the seamounts was close to the Mid-Atlantic ridge and that interaction with the Mid-Atlantic Ridge shaped them. We are mapping the magnetic anomalies around Walvis Ridge because they are poorly mapped from previous work (this is a remote place and few ships come here) and because the magnetic anomalies will show where the Mid-Atlantic Ridge was at times in the past. We will compare the radiometrically-determined ages from seamount dredge samples with the magnetic anomaly of the same age to figure out where the seamounts formed relative to the Mid-Atlantic ridge. That will help us test the hypothesis that the Mid-Atlantic Ridge affected these seamounts.
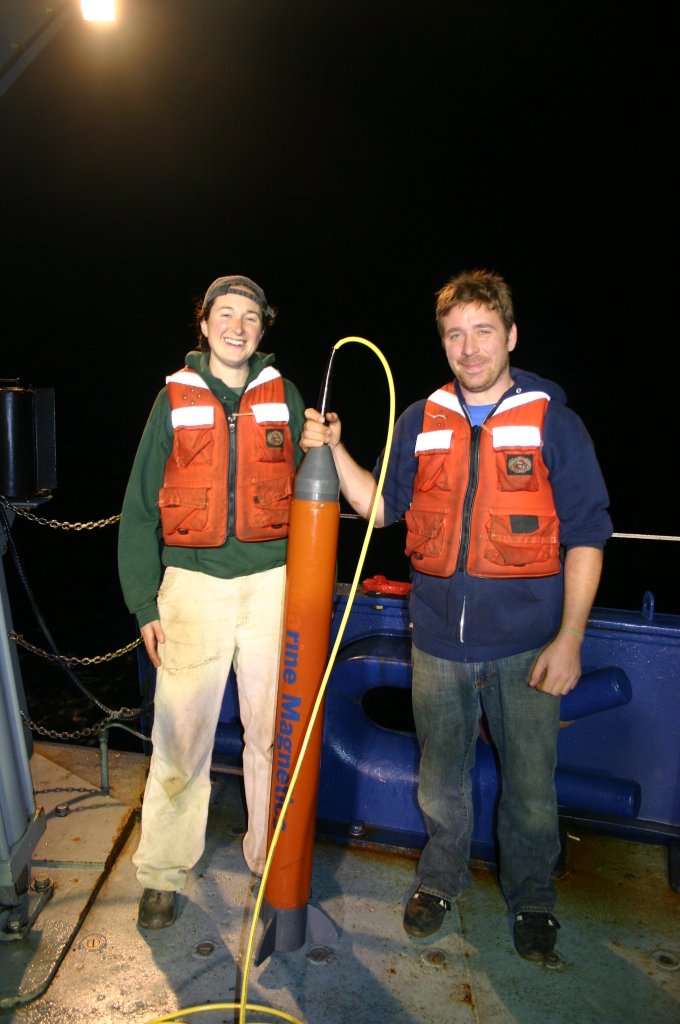
We collect seafloor magnetism data through the help of a special scientific instrument called a magnetometer. It consists of a magnetic sensor that is encapsulated in a torpedo-shaped container, referred to as a ‘towfish’. The magnetometer that we are using measures the intensity of Earth’s magnetic field using a property of quantum mechanics called proton spin resonance. This instrument is so sensitive that we can detect changes in the magnetic field of ± 0.1 nT (nanoTesla). Because of this sensitivity we must tow the magnetometer 300 meters behind the ship in an attempt to minimize the magnetic signature of the ferromagnetic metals in the hull of the ship. Once we have minimized any unwanted sources of magnetism, we can than set about collecting the magnetic signature of the oceanic crust.
We collect magnetic data in two different ways. One method is in long straight parallel lines that run perpendicular to a mid-ocean ridge. We do this as a way of recording the pattern of reversal events over time. The other method is to collect magnetic data as we survey around seamounts. We do this in an attempt to determine if they formed at the same time as the surrounding sea floor or afterwards, and if they formed gradually or over a short period of time.
Will Sager and Justin Nitz
- 11316 reads