[← pTRM tails check statistics] [↑ SPD on the web] [Anisotropic TRM →]
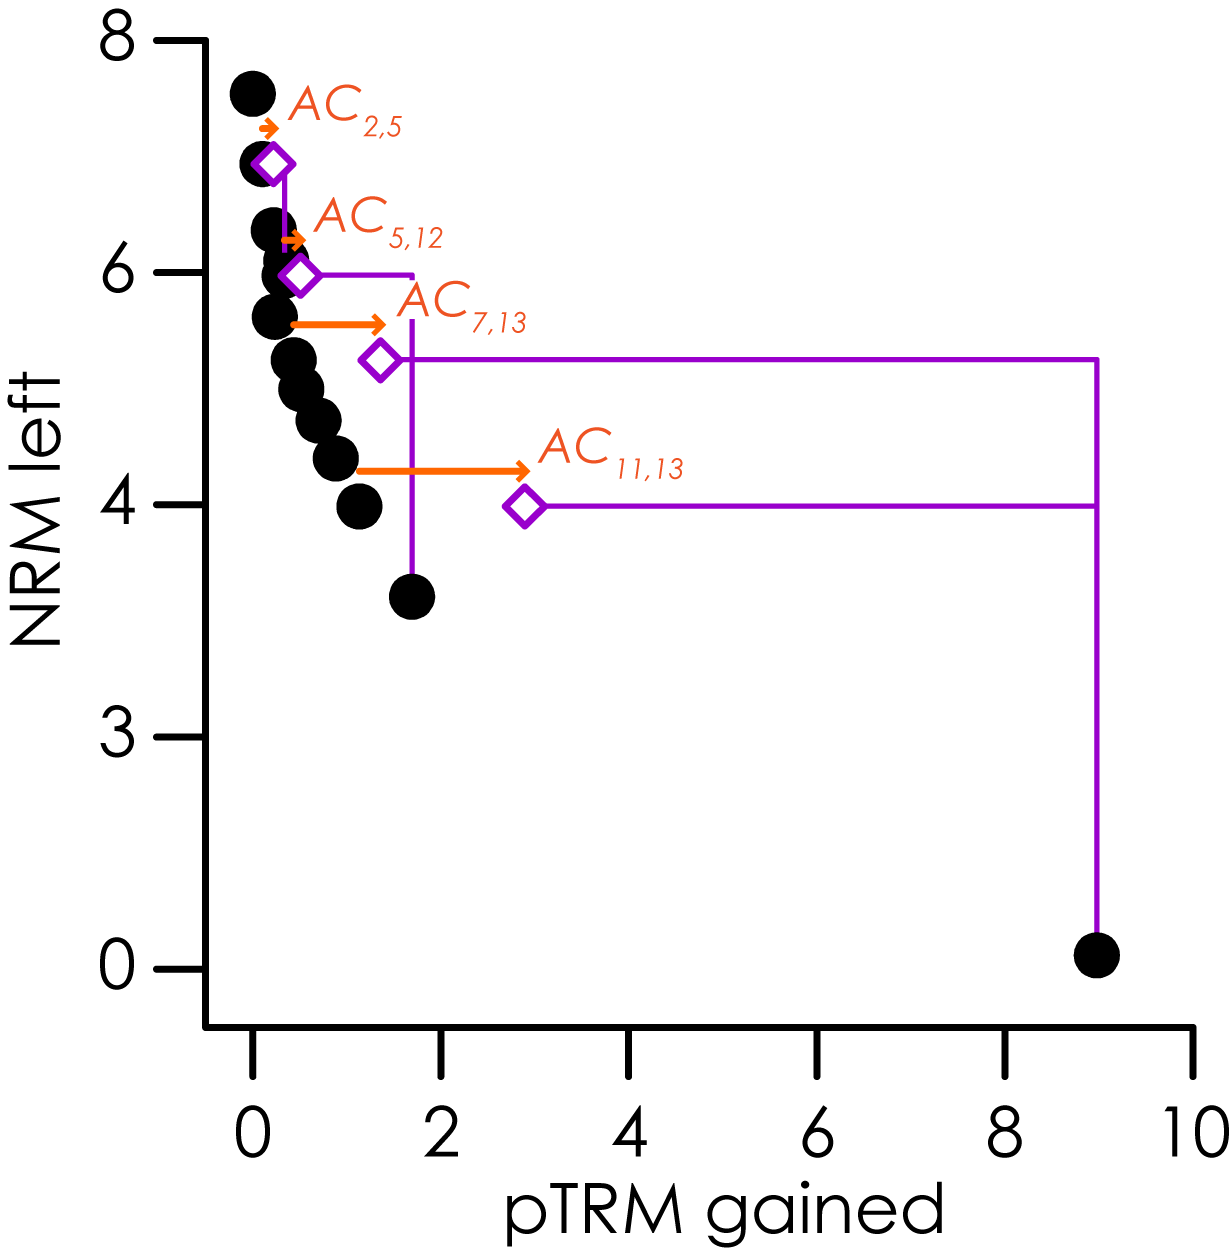
An additivity check is a repeat demagnetization step to test the validity of Thellier's law of additivity (Krása et al., 2003). In the course of a paleointensity experiment, a pTRM at temperature $$T_j$$ is imparted, pTRM($$T_j$$, $$T_0$$), where $$T_0$$ is room temperature. An additivity check demagnetizes pTRM($$T_j$$, $$T_0$$) by heating to $$T_i$$, where $$T_i < T_j$$. The remaining pTRM (pTRM($$T_j$$, $$T_i$$)) is subtracted from the previous pTRM acquisition step, pTRM($$T_j$$, $$T_0$$), to estimate pTRM$$^*$$($$T_i$$, $$T_0$$). That is \[ pTRM^*(T_i, T_0)=pTRM(T_j, T_0)-pTRM(T_j, T_i) \] where * denotes an estimated value. This estimated value can be compared with a previously observed value of pTRM($$T_i$$, $$T_0$$) that was measured earlier in the experiment. The difference between the estimated and observed pTRMs is a measure of the violation of additivity between $$T_i$$ and $$T_0$$. The additivity check difference ($$AC_{i,j}$$) is the scalar intensity difference between the two pTRMs: \[ AC_{i,j}=pTRM^*(T_i, T_0)-pTRM(T_i, T_0). \] For an additivity check to be included in the analysis, both $$T_i$$ and $$T_j$$ must be less than or equal to $$T_{max}$$.
Statistic: $$n_{Add}$$
The number of additivity checks used to analyze the best-fit segment on the Arai plot (i.e., the number of $$AC_{i,j}$$ with $$T_i \leq T_{max}$$ and $$T_j \leq T_{max}$$).
Statistic: $$\delta{AC}$$
Report to 1 d.p.
The maximum absolute additivity check difference normalized by the total TRM (obtained from the intersection of the best-fit line and the x-axis on an Arai plot; Leonhardt et al., 2004a). \[ \delta{AC}=\frac{\max{ \left\{ \left| AC_{i,j} \right| \right\} }_{i \leq end \textbf{ and } j \leq end}}{\left|X_{Int.}\right|}\times{100}. \]
↑ TOP