ArArCALC Help Library |
|||
ArArCALC Help Library |
|||
2.2 Raw Data Reduction
Functions that are specific to the Raw Data Reduction view will be discussed in this section. Some can be found in the File and Options menus and allow you to save your data regressions and change your sample parameters. However, the most important and most frequently-used functions you will find on the ArArCALC Toolbar. From this toolbar you can toggle data points in the data regressions, select different type of regressions, swap between the Ar36, Ar37 ... Ar40 argon isotopes, and more.
2.2.1 Save
ArArCALC saves all calculated argon intensities of a single experiment in a single Microsoft Excel Workbook that includes two plateau diagrams, two isochrons, and their respective data tables. To save your calculated Ar40, Ar39 ... Ar36 intensities, choose File # Save (Ctrl+S) from the menu bar. ArArCALC first checks if you have performed calculations for all five argon isotopes. If not, it will warn you that your calculations cannot be saved at the moment. Otherwise, it saves your calculations in the Age Calculation File that is stored in the user-defined Project directory with a file name based on the given Experiment Name. However, if you have been performing data reductions for Blank or Air data, your calculations will be saved in Text Files instead. These files are by default stored in the ArArCALC/Blanks and ArArCALC/Airs directories, based on the Measurement Date and the Experiment Name, respectively.

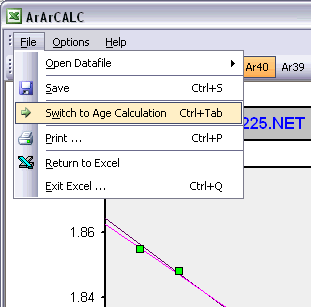
2.2.2 Switch to Age Calculation
Switching from the Raw Data Reduction view to the Age Calculation view while saving your calculations is very simple. To do so, you should select the File # Switch to Age Calculation (Ctrl+Tab) menu option. Your calculations will be automatically saved (see also: Saving Data Reductions) and, if not possible, you will be notified with a warning. This functionality allows you to reduce your argon mass spectrometry data and then directly switch to the age calculations to check on the results. During this switching you can always suppress the saving, if you hold down the SHIFT key.
2.2.3 Sample Parameters
As an ArArCALC user you have to set the Sample Parameters every time you open a Raw Mass Spectrometry data file (see also: Open Datafile). While you are performing the data regressions for these data, you can always recall this dialogbox via the Options # Sample Parameters menu in order to adjust your settings. The shown fields are always pre-filled with data from the previous calculation, even if these were performed a few days or weeks ago. Completing this dialogbox will be fast, because most entries will be similar and thus don't need changing when regression data from a single (incremental heating) experiment. Most likely, only the GMT datum and Temperature need editing, unless you start to reduce a totally new experiment. If your raw data files already have header lines containing this information, ArArCALC will transfer this header information into this dialogbox by using your Input Filter (see also: Setting the Preferences).
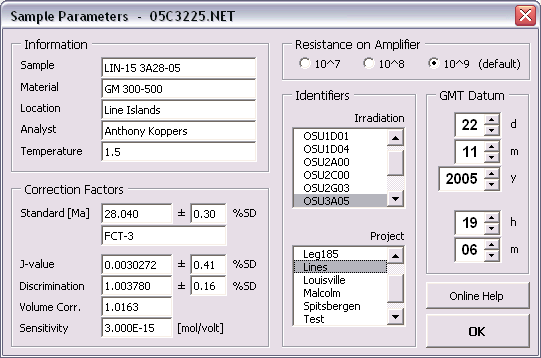
Information Panel
It is recommended that you use (as) descriptive (as possible) entries in the Information panel. Fill in sample name and position in the irradiation container in the Sample field, fill in mineral, rock type and grain size fraction in the Material
field, and enter full names (instead of initials) in the Analyst
field (see also: How to Insert Symbols in Microsoft Excel). In the Location
field try to fill in the "true" location name or (if not available) the name of the region or country (in order of preference). Finally, in the Temperature field fill in the incremental heating settings in either °C,
laser power in W or laser power in %. Don't enter the units here since you already predefined these in the Input Filter that you used while opening the data file (see also: Preferences).
You can always overwrite these default settings by selecting the correct unit from the Options # Heating Unit menu (see also: Heating Unit) when you are in the Age Calculation
view.
Correction Factors Panel
In this panel you have to fill in some of the most crucial Correction Factors that are required for the age calculations. First of all, you need to fill in the Standard Age (in Ma)
including its proper Standard Name. Next you have to fill in the infamous J-value, the Mass Discrimination Factor (see also: Mass Discrimination Corrections),
any needed Volume Correction (if you split your gas sample in any way) and the Sensitivity (in mol/volt). Because you have to provide both a Standard Age and the J-value,
this allows ArArCALC to calculate the data either as a flux monitor or as an unknown (see also: Calculate as Flux Monitor).
Resistance on Amplifier Panel
These options are only relevant if you have installed a Variable Resistor on the amplifier, which you can (automatically) switch according to the amount of gas introduced into your mass
spectrometer. Select the correct resistance value in order to let ArArCALC normalize the measured intensities to the Default Resistor (109) value. This means that when you select the 108 resistor
value that the intensities reported in ArArCALC are 10x higher than measured, and when you select the 107 value that the intensities reported are 100x higher. If you operate with a fixed resistor, you always should keep the default option selected
(see example above).
Identifiers Panel
This panel contains two list boxes in which you can select the Irradiation for your sample and under which Project to store the age calculations. Both lists
you manage yourself in the Irradiations and Projects dialogboxes and you should make certain that you have entered the appropriate irradiation and project for the sample you are currently processing (see also: Irradiations and Projects).
GMT Datum Panel
You have to set the Inlet Time of the argon gas in the mass spectrometer in this panel. Provide this information as the day (d), month (m), year (y), hour (h) and minute (m) by adjusting the spinner
buttons. Although it is preferred that you enter all times in GMT (Greenwich Mean Time), you can also provide local times in this panel. However, in the latter case, you should also make certain that the irradiation times were provided in the same time zone
units (see also: Irradiations and Projects) and that you take care of daylights saving time (if applicable in your country). It is highly recommended that you Date and Time
Stamp your data files, so that you automatically can read in this information from the header in these files (see also: Configuring the Input Filter).
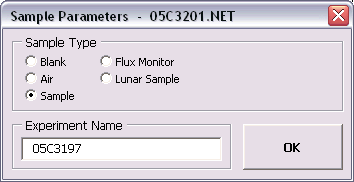
2.2.4 Sample Type and Experiment Name
Every time you open a Raw Mass Spectrometry data file (see also: Open Datafile) you have to specify the Sample Type and the Experiment Name under which you want to save the data to be used in your age calculations. While you are performing the data regressions for these data, you can always recall this dialogbox via the Options # Sample Type menu.
When filling in the Experiment Name make sure to use unique names (see also: File Name Conventions). In the example below, the Experiment Name is based on the name of the first analysis in an incremental heating experiment. If you are processing data for a single incremental heating experiment, a set of single crystal analyses from one sample or a set of irradiation monitors from the same position in an irradiation package, leave the Experiment Name unchanged so that all your data can be collected and saved in one-and-the-same age calculation file.
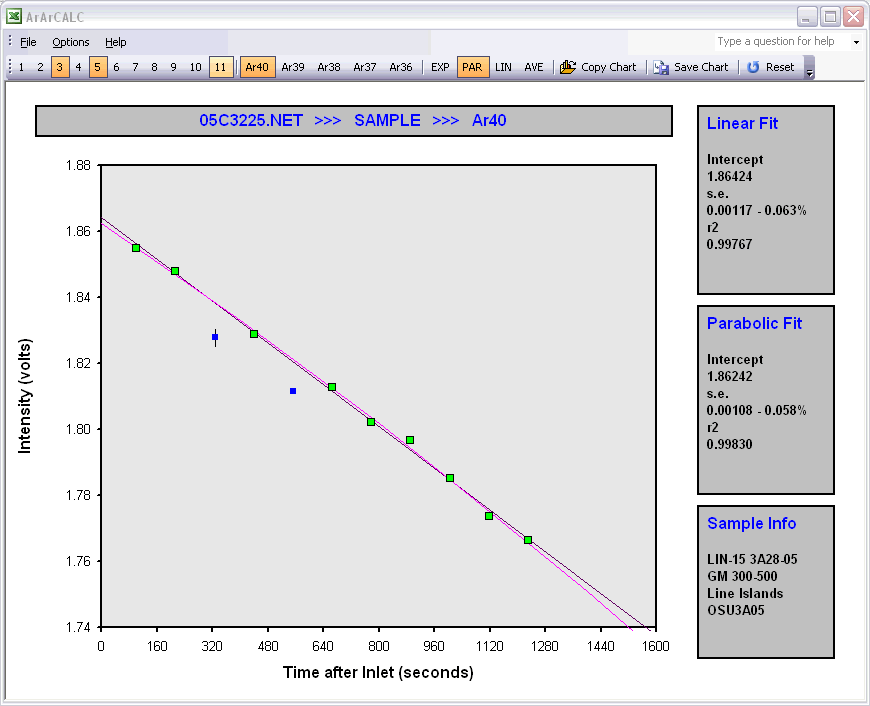
2.2.6 Ar40. Ar39 ... Ar36 Buttons
In the Raw Data Reduction view, a XY-scatter plot displays the measurement time (in seconds) after the inlet of the argon sample in the mass spectrometer on the X-axis, and the intensity of the beam on the Y-axis (in volts, amps or counts). By default, the intensity data for Ar40 is shown first (see below). Each different argon isotope should be calculated by clicking the isotope buttons Ar40, Ar39 ... Ar36 before you can save the data regressions.
2.2.7 EXP, PAR, LIN and AVE Buttons
When performing data regressions, ArArCALC does not decide which fit to the data (exponentional, parabolic, linear or average) gives the best results. For this purpose, you can set the default regression type for each argon isotope in the preferences (see also: Calculation Preferences). Only in one particular case, when the exponential and parabolic are similar to the linear least-squared fit, ArArCALC accepts a linear fit by default. However, based on the calculation results (see the boxes to the right of the scatter plot) you can always overrule these program decisions yourself, by choosing the appropriate button on the ArArCALC toolbar: Exp, Par, Lin or Ave. In the example below the parabolic fit has been chosen by the user.
2.2.8 Copy Chart
Click the Copy Chart button on the ArArCALC toolbar to copy the active chart to the Clipboard. Now you can paste the chart into your favorite drawing program, such as Adobe Illustrator, Canvas or CorelDraw. Most importantly, the copied chart will be pasted as Vector Graphics and thus it allows you to edit each drawing object and line in the diagram. However, in order to proceed, you first have to release all the masks, compound paths and/or groups. Do this on the entire selection at once. After these actions, you can always group together the age plateau lines (for example) by first selecting the line segments based on the color and weight of the line and then by selecting the group option. This will make working with these files more easy for you.
2.2.9 Save Chart
Click the Save Chart button on the ArArCALC toolbar to save the active chart as a GIF Image to your hard disk. The file will be saved in the Project Folder by default, that is the same folder as where your age calculation file is being saved. In addition, ArArCALC will name the the GIF Image based on the Experiment Name, alike the age calculation file.
2.2.13 Reset
The Reset button recalculates the data regressions including all data points. However, note that only the data points for the currently selected isotope will be reset.
See also ...
Contents ArArCALC Chapter 2 Function by Function Section 2.1 General Functions Section 2.3 Age Calculations Section 2.5 Editing Mode