ArArCALC Help Library |
|||
2.2.6 Ar40. Ar39 ... Ar36 Buttons
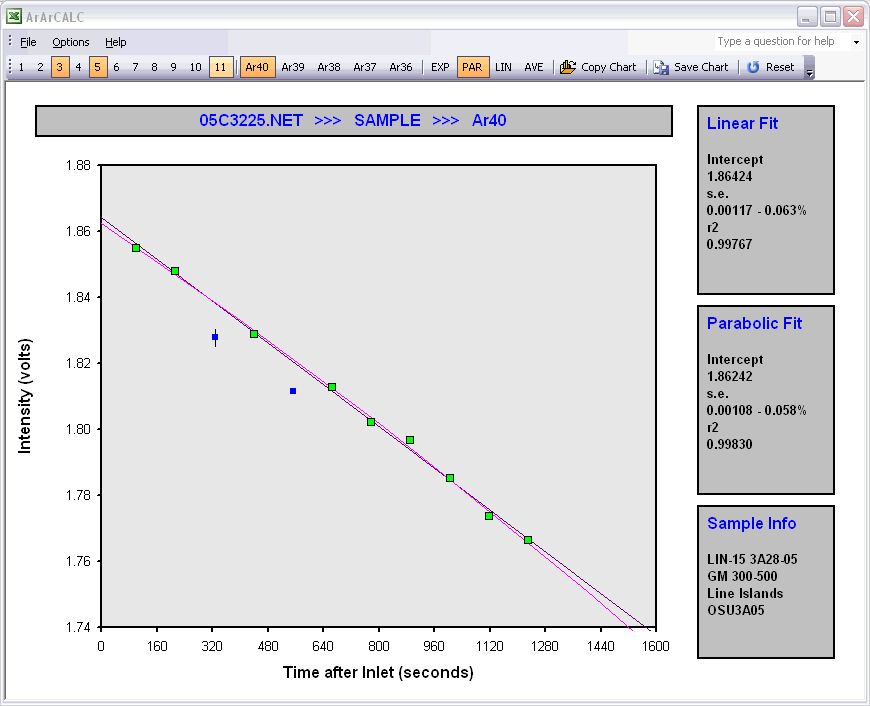
In the Raw Data Reduction view, a XY-scatter plot displays the measurement time (in seconds) after the inlet of the argon sample in the mass spectrometer on the X-axis, and the intensity of the beam on the Y-axis (in volts, amps or counts). By default, the intensity data for Ar40 is shown first (see below). Each different argon isotope should be calculated by clicking the isotope buttons Ar40, Ar39 ... Ar36 before you can save the data regressions.
