ArArCALC Help Library |
|||
1.5.4 Flagging Analyses in ArArCALC
Of course not every incremental heating experiment is perfectly concordant. So, you need to be able to easily Exclude discordant analyses (or steps) from your (incremental heating) experiments. On this help page three ways to do so are explained.
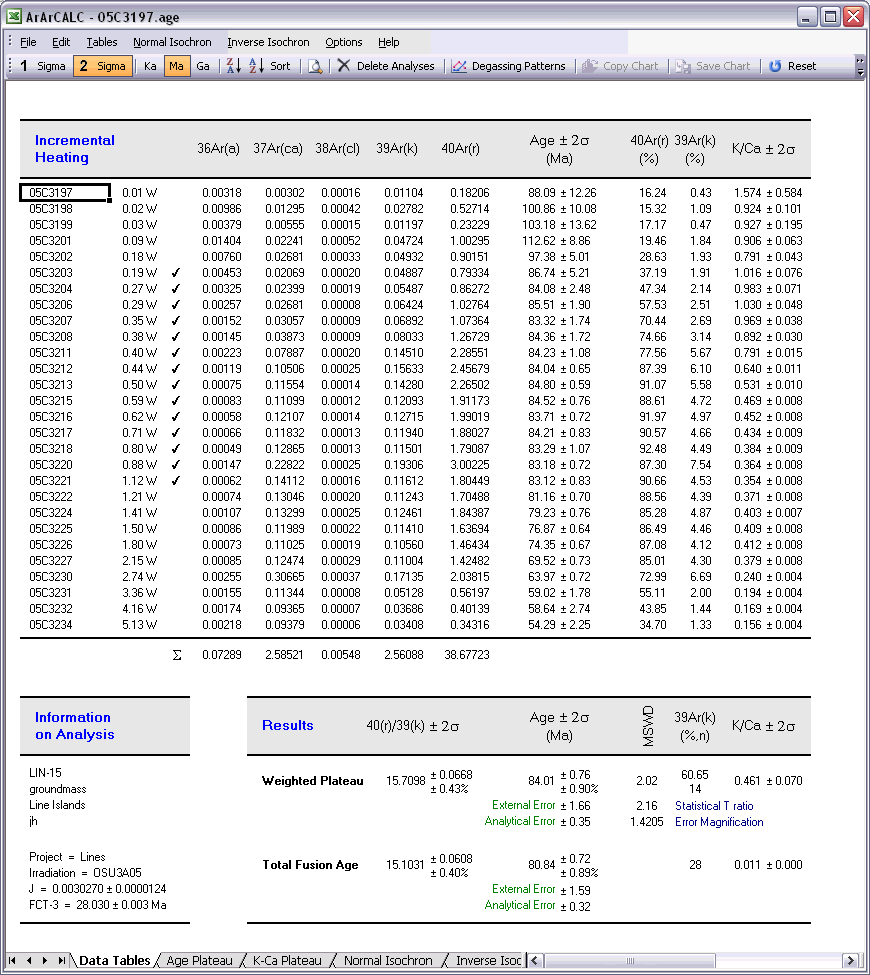
You can Flag Out your analyses for the age calculations in every data table by double-clicking the Checkmark symbols. When this action is performed ArArCALC recalculates all weighted averages and isochrons automatically, and updates all four diagrams. The total number of analyses included in the calculations are denoted in the Results panel (in this example, n = 14) as well as the total amount of released 39Ar(k) they represent (x = 60.65%). Flagging out multiple analyses is done by right-clicking every analyses that you want to exclude, ending by double-clicking the final one. Repeating these actions will include the analyses again. The Reset button recalculates including all data points.

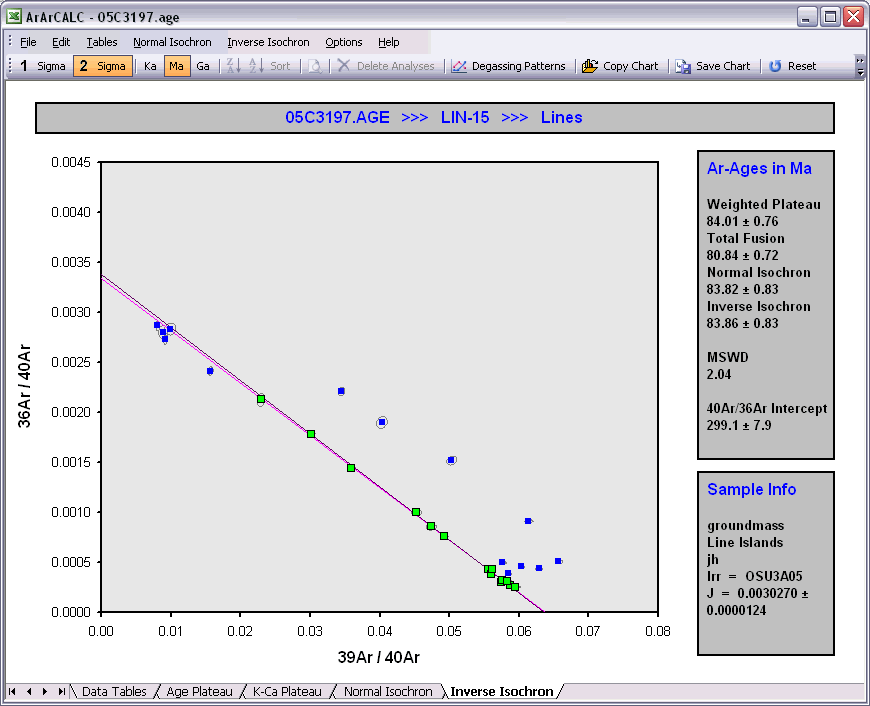
Flagging Out analyses can also be performed by deselecting points in the isochron diagrams. You can simply do this by left-clicking the data points (green squares) in these diagrams, which change into blue squares when excluded. When this action is performed, ArArCALC recalculates all weighted averages and isochrons. ArArCALC will update all diagrams as well. Flagging out multiple analyses is done by right-clicking every data point that you want to exclude, ending with left-clicking the final one. Repeating these actions on the blue squares will include the analyses again. The Reset button recalculates including all data points.

Raw Data Reduction Line Fit Diagrams
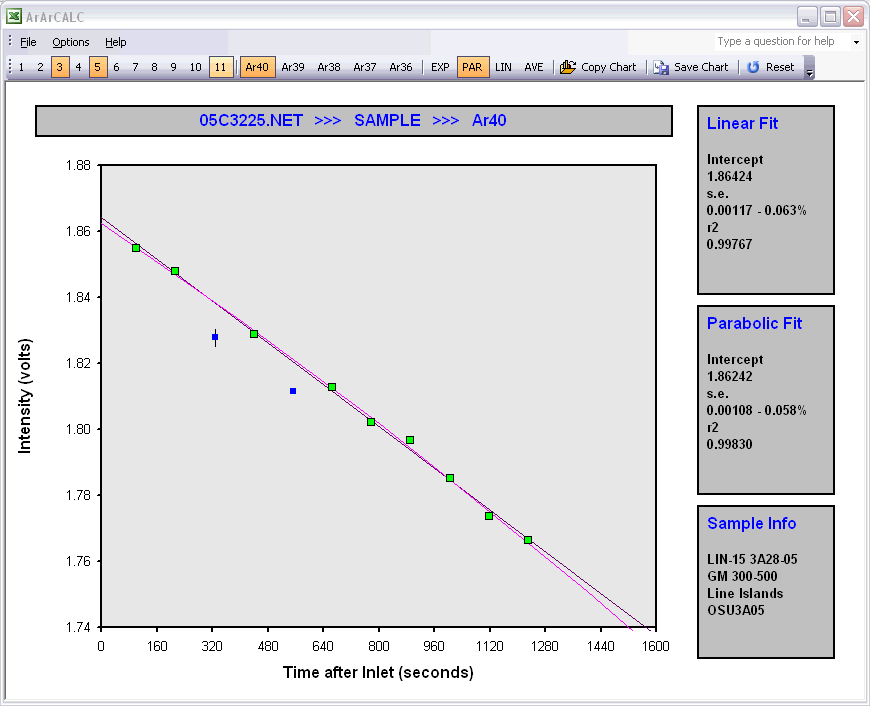
When you calculate line fits in the Raw Data Reduction view, you can exclude data points by either clicking the toolbar buttons 1, 2, 3 ... 11 that represent the data points or by left-clicking the single data points (green squares) on the diagram. Excluded data points are denoted by blue squares and suppressed toolbar buttons. Flagging Out multiple data points can be done by right-clicking each data point and ending with a final left-click. Repeating these actions on the blue squares or the suppressed toolbar buttons will include the analyses again. The Reset button recalculates including all data points.
