 |
 |
Complete Description TnT2000 is a MATLAB 6.0 toolbox for modeling both simple and sophisticated scenarios that mimic the geochemical differentiation of the Earth. This is achieved by an easy-to-use graphical user interface for defining multiple reservoirs and their intrinsic properties in order to approximate global reservoir geometries, their evolution and the mass fluxes between them. TnT2000 has been developed for Windows 95/98/NT/2000/XP but can be used under the Linux and UNIX operating systems as well. In addition, TnT2000 has a modular design that allows for the use and expansion of different algorithms of partial melting, alteration, mixing, entrainment, recycling and mantle convection. TnT2000 is distributed as freeware.
Model Input Defining global reservoir models in TnT2000 is made simple through the use of two wizards. In the "Reservoir Editor" the user defines the reservoir geometry, the initial components, the general calculation settings, and the heat flow model that drives mantle convection and, hence, the differentiation rates. Reservoir geometries are simply defined by setting the number of reservoirs and the number of components within each reservoir, whereas differentiation of these reservoirs over geological time can be achieved by setting their number of melt and alteration stages.
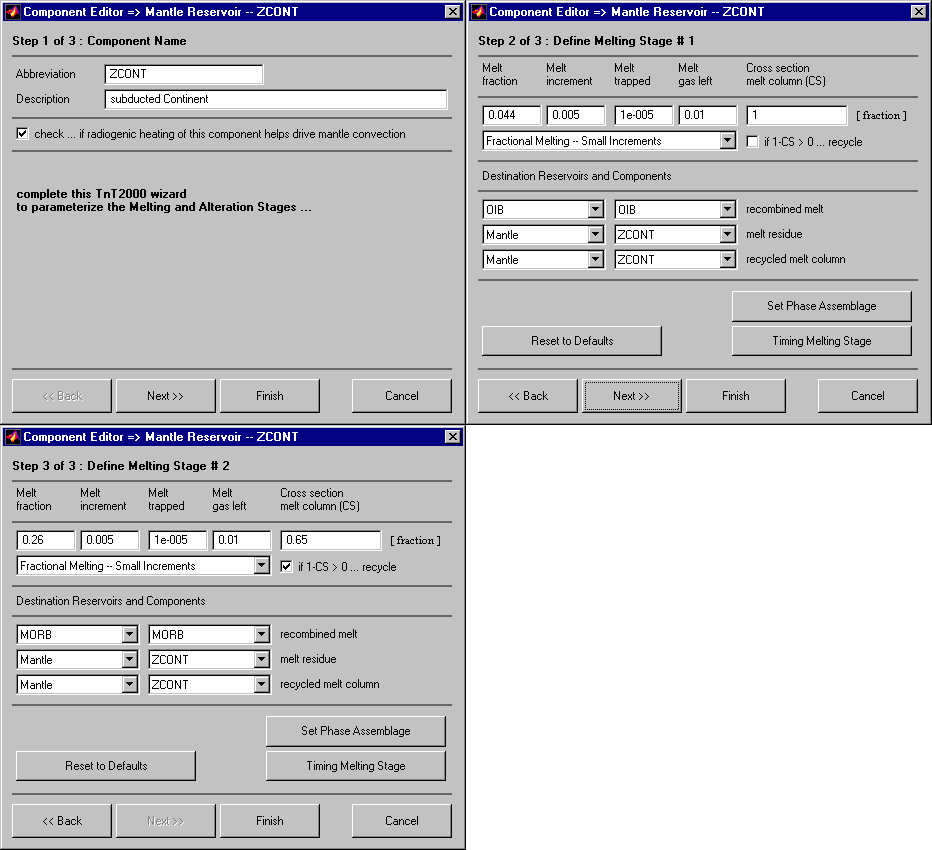
In the "Component Editor" the actual melt and alteration processes can be parameterized. For example, in case of the melting processes, the total melt and increment fractions can be defined together with their melting law. Other important settings include the definition of typical phase assemblages for melting and the timing of the melting processes. 
Model Calculation Running a model in TnT2000 is just one mouse-click away ... click the "Start Calculation" button. An activity bar will progressively show the model time (in Ma) of the ongoing calculation. When the calculations are finished the "Plotting" menu bar will be activated and the user can generate up to 6 different diagrams to view the modeling results.
Model Output Below here one of TnT2000's plotting tools is displayed. Sr concentrations (in ppm) are plotted against model time (in Ga) for all components as defined in the reservoir geometry. In this example, not only the actual components are plotted, but also the (logged) melt resulting from OIB and MORB melting. The user can easily change the output in this plotting tool by selecting another element or isotope, or by choosing to calculate ratios, reciprocals or differentiation patterns. The output can also be normalized against the composition of the initial component in the reservoir geometry.
|
||||