[← Directional statistics] [↑ SPD on the web] [pTRM tails check statistics →]
A pTRM check is a repeat TRM acquisition step to test for changes in a specimen's ability to acquire TRM at blocking temperatures below the temperature of the check.
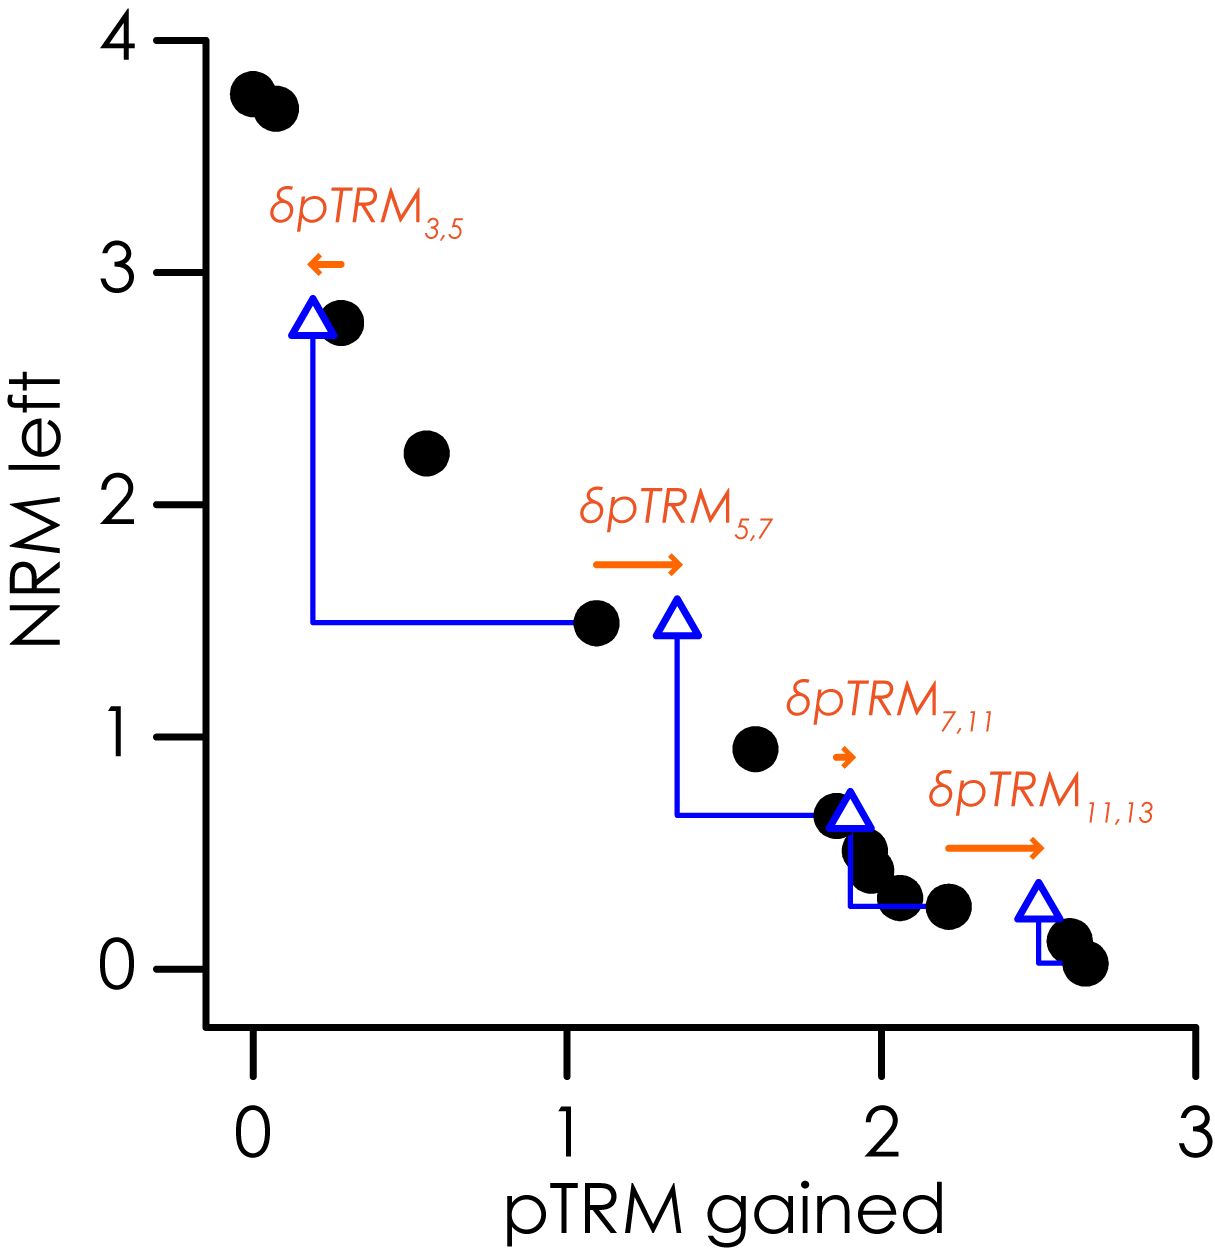
difference between a pTRM check and the original TRM is calculated as the scalar intensity difference. That is,
\[
\delta{pTRM_{i,j}}=pTRM\_check_{i,j} - TRM_i = pTRM\_check_{i,j} -x_i,
\]
where $$pTRM\_check_{i,j}$$ is the pTRM check to the $$i^{th}$$ temperature step after heating to the $$j^{th}$$ temperature step. The order of the difference is such that
pTRM checks smaller than the original TRM yield negative $$\delta{pTRM_{i,j}}$$ and pTRM checks larger than the original TRM give positive $$\delta{pTRM_{i,j}}$$. For a pTRM
check to be included in the analysis, both $$T_i$$ and $$T_j$$ must be less than or equal to $$T_{max}$$.
Statistic: $$n_{pTRM}$$
The number of pTRM checks used to analyze the best-fit segment on the Arai plot (i.e., the number of $$pTRM_{i,j}$$ with $$T_i \leq T_{max}$$ and $$T_j \leq T_{max}$$).
Statistic: $$check(\%)$$
Report to 1 d.p.
Maximum absolute difference produced by a pTRM check, normalized by the TRM acquired at that heating step. \[ check(\%)=\max{ \left\{ \frac{\left| \delta{pTRM_{i,j}} \right| }{x_i}\times{100}\right\} }_{i \leq end \textbf{ and } j \leq end} \]
Statistic: $$\delta{CK}$$
Report to 1 d.p.
Maximum absolute difference produced by a pTRM check, normalized by the total TRM (obtained from the intersection of the best-fit line and the x-axis on an Arai plot; Leonhardt et al., 2004a). \[ \delta{CK}=\frac{\max{ \left\{ \left| \delta{pTRM_{i,j}} \right| \right\} }_{i \leq end \textbf{ and } j \leq end}}{\left|X_{Int.}\right|}\times{100} \]
Statistic: $$DRAT$$
Report to 1 d.p.
Maximum absolute difference produced by a pTRM check, normalized by the length of the best-fit line (Selkin and Tauxe, 2000). \[ DRAT=\frac{\max{\left\{\left|\delta{pTRM_{i,j}} \right| \right\}}_{i \leq end \textbf{ and } j \leq end}}{L}\times{100}, \] where $$L$$ is the length of the best-fit line on the Arai plot. $$L$$ is given by: \[ L=\sqrt{ (\Delta{x'})^2 + (\Delta{y'})^2 }, \] where $$\Delta{x'}$$ and $$\Delta{y'}$$ are TRM and NRM lengths of the best-fit line on the Arai plot, respectively (Section 3).
Statistic: $$maxDEV$$
Report to 1 d.p.
Maximum absolute difference produced by a pTRM check, normalized by the length of the TRM segment of the best-fit line on the Arai plot (Blanco et al., 2012). \[ maxDEV=\frac{\max{\left\{\left|\delta{pTRM_{i,j}} \right| \right\}}_{i \leq end \textbf{ and } j \leq end}}{\Delta{x'}}\times{100} \]
Most cumulative pTRM checks can be calculated in two fashions. The first method, is the summation of the signed pTRM differences (i.e., $$\pm \delta{pTRM}$$), the second is to calculate the sum of the absolute pTRM difference (i.e., $$\left|\delta{pTRM}\right|$$). The convention of the Standard Paleointensity Definition is to denote the second approach with a prime ($$'$$). For example, $$CDRAT$$ is calculated by the first method and $$CDRAT'$$ by the second.
Statistic: $$CDRAT$$
Report to 1 d.p.
Cumulative $$DRAT$$ (Kissel and Laj, 2004). \[ CDRAT=\frac{\left|\sum\limits_{i=1}^{end}{\delta{pTRM_{i,j}}}\right|}{L}\times{100} \] \[ CDRAT'=\frac{\sum\limits_{i=1}^{end}{\left|\delta{pTRM_{i,j}}\right|}}{L}\times{100} \]
Statistic: $$DRATS$$
Report to 1 d.p.
Cumulative pTRM check difference normalized by the pTRM gained at the maximum temperature used for the best-fit on the Arai diagram (Tauxe and Staudigel, 2004). \[ DRATS=\frac{\left|\sum\limits_{i=1}^{end}{\delta{pTRM_{i,j}}}\right|}{x_{end}}\times{100} \] \[ DRATS'=\frac{\sum\limits_{i=1}^{end}{\left|\delta{pTRM_{i,j}}\right|}}{x_{end}}\times{100} \]
Statistic: Mean $$DRAT$$
Report to 1 d.p.
The average difference produced by a pTRM check, normalized by the length of the best-fit line. \[ \textrm{Mean }DRAT=\frac{1}{n_{pTRM}}\frac{\left|\sum\limits_{i=1}^{end}{\delta{pTRM_{i,j}}}\right|}{L}\times{100} \] \[ \textrm{Mean }DRAT'=\frac{1}{n_{pTRM}}\frac{\sum\limits_{i=1}^{end}{\left|\delta{pTRM_{i,j}}\right|}}{L}\times{100} \]
Statistic: Mean $$DEV$$
Report to 1 d.p.
Mean deviation of a pTRM check (Blanco et al., 2012). \[ \textrm{Mean }DEV=\frac{1}{n_{pTRM}}\frac{\left|\sum\limits_{i=1}^{end}\delta{pTRM_{i,j}}\right|}{\Delta{x'}}\times{100} \] \[ \textrm{Mean }DEV'=\frac{1}{n_{pTRM}}\frac{\sum\limits_{i=1}^{end}\left|\delta{pTRM_{i,j}}\right|}{\Delta{x'}}\times{100}. \]
Statistic: $$\delta{pal}$$
Report to 1 d.p.
A measure of cumulative alteration determined by the difference of the alteration corrected intensity estimate (Valet et al., 1996) and the uncorrected estimate, normalized by the uncorrected estimate (Leonhardt et al., 2004a).
We first calculate the cumulative sum of the pTRM checks up to the $$i^{th}$$ step of the experiment:
\[
\mathbf{C}_i=\sum\limits_{l=1}^{l=i}{ \mathbf{\delta{pTRM}}_{l,j} }, ~~\textrm{for} ~i=1,\ldots, n_{max},
\]
where $$\mathbf{\delta{pTRM}}_{l,j}$$ is the vector difference between $$\mathbf{TRM}_l$$ and $$\mathbf{pTRM\_check}_{l,j}$$, i.e.,
\[
\mathbf{\delta{pTRM}}_{l,j}=\mathbf{TRM}_l - \mathbf{pTRM\_check}_{l,j}.
\]
When no pTRM check is performed $$\mathbf{\delta{pTRM}}_l=[0,0,0]$$.
The $$\mathbf{TRM}_i$$ vector is then corrected by adding the cumulative effect of the alteration, $$\mathbf{C}_i$$:
\[
\mathbf{TRM}_i^*=\mathbf{TRM}_i+\mathbf{C}_{i}, ~~\textrm{for} ~i=1,\ldots, n_{max}.
\]
Since no pTRM check is performed at the first step:
\[
\mathbf{TRM}_1^*=\mathbf{TRM}_1.
\]
The corrected TRM values on the Arai plot ($$x_i^*$$) can be calculated by determining the vector lengths of $$\mathbf{TRM}_i^*$$. The corrected slope on the Arai plot ($$b^*$$) can be calculated using the selected points and the standard approach outlined in Section 3. $$\delta{pal}$$ is then given by: \[ \delta{pal}=\left|\frac{b-b^*}{b}\right|\times100. \]
↑ TOP